0 Introduction
As a new type of weapon, thermobaric weapon has been widely concerned in recent years. The high heat and shock wave produced by its explosion are all-pervasive. This unique damage effect is incomparable to that of traditional ammunition. It is especially suitable for killing enemies in closed spaces such as caves, underground fortifications, buildings and so on
[1]. Thermobaric bomb has the characteristics of both high explosive and air-fuel bomb. Aluminum, titanium, magnesium, zirconium, silicon and boron powders are added to the high explosive, which further enhances the thermal effect and pressure effect of thermobaric bomb explosion and plays a significant energy multiplication effect. The thermobaric bomb is developed from the early air-fuel bomb. After more than 20 years of development, it has formed a series of products, including not only the short-range thermobaric bomb for individual soldiers that can be directly carried on the shoulder, but also the thermobaric grenade and rocket launched by artillery, as well as the thermobarical bomb and air-to-ground missile launched by fighter planes in the air. After continuous development and improvement, the thermobaric bomb has begun to gradually expand to the direction of miniaturization and multi-carrier launching. In order to improve the energy density of the thermobaric bomb, countries have begun to look for new combustion materials
[2]. Metallic hydrogen storage materials are widely used as additives in explosives, propellants and other energetic materials due to their high energy density, high combustion heat value and high energy release efficiency, among which TiH
2 is one of the most representative materials
[3⇓-5]. Xue et al. Studied the RDX grain added with TiH
2 powder, and the results showed that TiH
2 could significantly improve the shock wave energy and bubble energy of RDX underwater explosion, and the smaller the particle size, the better the effect
[6]. Comet et al. Developed a new initiating component with ammonium dinitramide as oxidizer and TiH
2 as fuel, which has a heat of explosion higher than 7 kJ/G and a detonation velocity range of 1.2 – 2.0 km/s in a tube with a diameter of 3 mm
[7]. Cheng et al. Studied the effect of TiH
2 on the brisance of emulsion explosive, and experimentally measured that the lead column compression of emulsion explosive with the addition of TiH
2 powder was 23.80 mm, which was 7.7 mm higher than that without the addition of TiH
2 powder
[8]. Wu et al. Used a Hartmann tube and a 20 L spherical explosion vessel to study the explosion characteristics of TiH
2. Compared with the theoretical combustion heat, the combustion ratio of TiH
2 was greater than 96.0%, and the combustion heat value was 20.94 mJ/kg
[9]. Cheng et al. Deeply studied the cloud explosion characteristics and explosion mechanism of TiH
2 dust, and found that the combustion mechanism of TiH
2 dust cloud is mainly controlled by the diffusion mechanism, and the existence form of hydrogen element has no significant effect on the explosion pressure.However, it has a great effect on the pressure rise rate. In addition, the flame propagation speed, burning speed, maximum pressure and maximum pressure rise rate of TiH
2 dust are higher than those of Ti dust with the same dust concentration
[10⇓-12].
In addition to shock wave pressure, explosion temperature and flame propagation speed are also important indicators to measure the damage effectiveness of thermobaric bomb
[1]. In the aspect of explosion temperature field measurement, the measurement methods are mainly divided into two categories: contact and non-contact. The main characteristics of contact temperature measurement are that the temperature measurement requirements are simple and the equipment is easy to operate, but the sensor needs to contact with the measured object and can not be reused, and the temperature response speed can not meet the measurement requirements of transient high temperature
[13]. Compared with the contact temperature measurement method, the non-contact temperature measurement method can detect the surface temperature of an object, has a wide temperature measurement range and a fast response speed, and is suitable for the measurement of explosion transient high temperature. In recent years, colorimetric temperature measurement technology has been applied in the field of explosive temperature measurement. This method does not need to obtain the emissivity of the measured object, and has incomparable advantages over infrared temperature measurement methods
[14-15]. In the aspect of flame propagation speed test, the powerful contour detection function of Python software OpenCV library is used to calculate the change of flame front position with time, and the speed and acceleration of flame propagation can be obtained
[16].
In This paper, the explosion of thermobaric bomb in the air and in the underground tunnel is simulated by using open and semi-open Hartmann tube, respectively, with the help of high-speed camera, attenuator and self-compiled Python program.The temporal and spatial distribution of flame temperature field, propagation velocity and acceleration of TiH2 dust cloud confined in open space and duct were studied. The research results can provide technical and theoretical guidance for the formulation design and damage effectiveness evaluation of thermobaric bomb.
1 Materials and apparatus for dust explosion experiment
The average particle size of commercial grade Thermo Fisher Scientific powder (hydrogen storage capacity 3.85%, produced by Thermo Fisher Scientific Company, USA) is D50=7.6μm, the average particle size of commercial grade Ti powder (produced by Baoji Quanxing Titanium Industry Co., Ltd.) is D50=7.2μm, and the particle size distribution and microstructure characteristics are shown in Fig. 1; Air (20.98% O2+79.02% N2, produced by Hefei Henglong Electric Co., Ltd.) with a purity of 99.99%.
Fig.1 Particle size distribution and microstructural characteristics图1 粉尘粒度分布和微观结构特征 |
Full size|PPT slide
Open and semi-open Hartmann tubes were used to study the flame propagation and temperature distribution of TiH2 dust under unconfined and confined conditions, respectively. Before the start of the experiment, a certain amount of TiH2 powder was weighed and placed on the bottom tray of the Hartmann tube, and then the dust was lifted by the air in the gas tank, and finally the ignition process was completed by a 15 kV high-energy igniter. At the moment of ignition of the open Hartmann tube (see Fig. 2 (a)), the middle tube body (which can slide up and down) will fall down to form an open space, the powder injection time is 0.02s, and the delay time from powder injection to ignition is 0.1s; The semi-open Hartmann tube (see Fig. 2 (B)) is sealed at the top of the tube with tissue paper, which is broken during the dust deflagration process. The dusting time is 0.02 s, and the delay time from dusting to ignition is 0.13 s. The push-pull electromagnet, solenoid valve and ignition electrode are controlled by a programmable logic controller (PLC), and a high-speed camera is used to record the whole process of dust flame propagation.
Fig.2 Hartmann tubes图2 哈特曼管 |
Full size|PPT slide
2 High-speed two-dimensional measurement method
The high-speed two-dimensional measurement platform is composed of a high-speed camera, an attenuator, a computer and a self-compiled Python calculation program. As shown in Fig. 3, the gray images of dust flame propagation process are collected by high-speed camera and attenuator, and then the Python program is used to process the gray images to obtain the velocity and acceleration time curves of flame propagation and the dynamic flame temperature distribution nephogram, and the data are visualized and output. The self-compiled Python program can realize two functions: 1) the dynamic temperature distribution nephogram of the flame propagation process is obtained through the interpolation operation and colorimetric calculation of the gray image information; 2) Through the contour detection of the gray image, the speed and acceleration of the flame in the dynamic propagation process are calculated.
Fig.3 Realization process of high-speed two-dimensional measurement图3 高速二维测量的实现过程 |
Full size|PPT slide
2.1 Calculation of flame temperature distribution
The CMOS camera uses a single-lens image sensor and uses a Bayer array in GRBG mode, as shown in Figure 4. The array can be seen as a two-dimensional matrix, where I and J represent the coordinate positions of a single sensor.The R, G or B mark at each position in the figure represents the color component collected by the sensor (corresponding to different light bands respectively), and the temperature single-valued function shown in formula (1) can be obtained by calculating the ratio of the signals in different bands:
[17] Fig.4 Bayer array of high-speed cameras图4 高速彩色相机的拜尔阵列 |
Full size|PPT slide
Where: T is the thermodynamic temperature; c2 is Planck's second radiation constant; λn is the wavelength, and n=1,2;ε(λn,T) represents the emissivity of the object at wavelength λi; K is the ratio of the radiance of the blackbody at two wavelengths of λ1 and λ2 at temperature T, which can be expressed by formula (2):
It can be seen from equations (1) and (2) that the ratio of radiation wavelength brightness is basically linear with temperature. In theory, as long as the R, G and B pixel values are known, the temperature value of the point can be calculated. The image taken by the Bayer array is an 8 bit gray image, and a color image containing R, G, and B channels can be obtained after interpolation of all pixels, and the signal intensity ratio of the R and G channels is selected to obtain the temperature information. The R, G, B pixel values of each pixel can be obtained by using Python 3.8 to write Hamilton interpolation algorithm to process the gray image
[18].
2.2 Dust flame speed and acceleration
2.2.1 Contour detection
The images of flame propagation are captured by a color CMOS camera and output in 8 bit grayscale format. Sometimes there are noise data (such as dust particles and combustion products in dust explosion) in the obtained flame images, which will interfere with the subsequent image processing. In order to eliminate the isolated noise points in the target image as much as possible while protecting the edge information of the image, the median filtering method in OpenCV library is used to preprocess the image. Median filtering is a nonlinear signal processing technique based on sorting statistical theory, which can effectively suppress noise. It sets the gray value of each pixel as the median of the gray values of all pixels in a neighborhood window of the point. The grayscale image is usually stored in the form of a two-dimensional matrix. For each pixel point Xi,j, in the N-order (N is an odd number) matrix centered on this point, the median Yi,j of all pixel values is taken as the filtered value of this point, which is expressed by Equation (3):
Yi,j=Median{Xi+k,j+k|k∈Z,-N≤k≤N}
The filtered image preserves the effective information of the edge and reduces the interference of noise, but due to the transmission of most of the flame and the plasma state,There is no obvious transition from the flame edge to the pixel value of the space, which shows that the brightness of the flame edge is gradually flat in the gray image, and this phenomenon brings difficulties to the subsequent edge detection.
In order to make the image show more obvious contrast effect, the filtered image is binarized. Image binarization is the process of setting the pixel value of an image to 0 or 255 according to the threshold, as shown in equation (4):
In the formula, dst (X, y) is the binarized pixel value, and (X, y) represents the coordinate position of the pixel point; scr (X, y) is the original pixel value of the pixel located at row X and column y. For any pixel point in row X and column y, dst (X, y) is determined by the relationship between its original pixel value scr (X, y) and the artificially set threshold value threshold. When the original pixel value is greater than the threshold value, it is changed to 255, otherwise it is changed to 0, and finally a black and white binary image is obtained. The adaptive threshold method is provided in the OpenCV library, which can automatically set the most appropriate threshold according to the actual effect of each image, bringing great convenience to the binarization of the image. Figure 5 shows the effect of converting a color flame image into a grayscale image and performing filtering and binarization operations.
Fig.5 Flame image processing图5 火焰图形 |
Full size|PPT slide
The purpose of edge detection is to identify the points with significant brightness changes in the image. In the image, these points with significant changes usually reflect important events and changes, such as discontinuities in depth, discontinuities in surface direction, changes in scene brightness values, etc. After binarization processing, the pixel value of the flame image is 255 at the flame and 0 at the space, and the pixel value between the flame edge and the space has an obvious transition, which makes the edge detection operation more accurate. The image after edge detection greatly reduces the amount of data, eliminates unnecessary information points inside and in the space of the flame, and only retains the frame structure attribute of the flame. OpenCV library provides a variety of edge detection operators such as Prewitt operator, Sobel operator, Canny operator and Laplacian operator. Different edge detection operators have their own advantages in different scenes. After many experiments and comprehensive comparison, this paper finally uses Sobel operator to detect the edge. The image obtained by edge detection usually has various interference data, such as texture and noise data contained in the interior, and small flames far away from the whole flame when the flame propagates. Contour detection can select the appropriate edge as the processing object on the basis of edge detection, and it can connect all continuous points with the same color or intensity along the boundary. Generally, for an image with complex texture such as flame, the outermost maximum continuous contour is selected as the front position of the flame, and the drawn contour will only contain the external point set and not the internal texture, as shown in Figure 6.
Fig.6 Flame image processing图6 火焰图形处理 |
Full size|PPT slide
2.2.2 Calculation method
In this paper, two flame propagation models of TiH2 dust in unconfined and semi-confined open space are studied. In the open space unconfined flame propagation model, in order to avoid the influence of vertical gravity and buoyancy, the horizontal flame propagation is selected as the research object. In the model of flame propagation in a semi-open duct, the flame propagation along the axial direction of the duct is selected as the research object. By studying the variation of the distance from the ignition electrode to the flame front with time, the velocity and acceleration of flame propagation are obtained. The OpenCV library provides a method to find the minimum bounding rectangle of the flame after contour detection by taking the contour as the input parameter and the coordinates of the minimum rectangular frame containing the contour as the output.The coordinates (X, y) of the upper left corner of the rectangular frame, the height H and width w of the rectangular frame can be obtained, and one side of the rectangular box is the position of the flame front, and the coordinates of the contour line at the flame front can be obtained through X, y, w and H.
It should be noted that the coordinates calculated by the code are the pixel units of the contour in the image. In order to obtain its true length, a calibration experiment is needed. As shown in Figure 7, a luminous cube is used as the reference object in the calibration experiment, and the real side length Lt of the cube can be known by measurement, and the parameters such as distance and focal length during shooting should be consistent with those in the experiment. The edge detection and contour area calculation of the photographed calibration object are carried out to obtain the Lp of the pixel side length.
Fig.7 Length proportional calibration experiment图7 长度比例标定实验 |
Full size|PPT slide
The calibration coefficient is expressed by the ratio of the true side length Lt of the calibration object to the pixel side length Lp, as shown in Equation (5):
In the flame propagation model under the conditions of open space, unconfined and semi-open pipe, the radius change or flame height change between each picture expresses the displacement change of the flame front, and the time interval between each picture is determined by the frame rate at the time of shooting. Let ΔL denote the displacement variation of the flame front between two images, Δt denote the time interval of two images, denote the propagation speed of flame in Δt time interval, Δv denote the variation of flame propagation speed in Δt time interval, and ɑt denote the acceleration of flame in Δt interval, then vt and ɑt are expressed as
3 Experimental results and analysis
3.1 Flame characteristics of TiH2 dust in open space
An open Hartmann tube was used to study the flame characteristics of a TiH
2 dust cloud in an open space. Fig. 8 shows the free propagation process of the TiH
2 dust cloud flame with the concentration of 500g/m
3, and Fig. 9 shows the dynamic distribution nephogram of the TiH
2 dust cloud flame temperature calculated by using the Python program based on the colorimetric temperature measurement principle (corresponding to the process in Fig. 8). It can be seen from Fig. 9 that the flame propagates spherically in the early stage (0 ~ 20ms) and the overall temperature is lower than that in the later stage of stable combustion. With the outward propagation of the flame surface, the temperature of the flame front is the highest, and the closer to the flame center, the temperature gradually decreases. The reason for this phenomenon is that the flame front is the combustion reaction zone, the concentration of O
2 is higher, the TiH
2 dust burns more fully, and more heat is released. In addition, it can be seen from the temperature nephogram of dust cloud flame propagation TiH
2 that the temperature below the flame is higher than that above the flame along the vertical direction, and the dust concentration gradient is the main reason for the uneven temperature
[19].
Fig.8 High-speed camera photos of TiH2 dust cloud flame propagated in an open space图8 敞开空间内TiH2粉尘云火焰传播高速摄像 |
Full size|PPT slide
Fig.9 High-speed two-dimensional dynamic temperature distribution maps of TiH2 dust cloud (500g/m3) flame in an open space图9 敞开空间内TiH2粉尘云(500g/m3)火焰传播高速二维温度动态分布 |
Full size|PPT slide
In order to study the effect of dust concentration on dust cloud flame characteristics of TiH2,The flame temperature dynamic distribution nephogram and the time-history curves of flame propagation distance, velocity and acceleration are calculated respectively when the dust cloud concentration of TiH2 is 500g/m3, 667g/m3, 833g/m3 and 1000g/m3, as shown in Fig. 10. The mass of TiH2 powder corresponding to the dust concentrations 500g/m3, 667g/m3, 83g/m3, and 1000g/m3 in the experiment was 0.6 G, 0.8 G, 1.0 G, and 1.2 G, respectively. Fig. 10 (a) shows that the flame temperature of TiH2 dust is in the range of 2150 – 2400 K, and the flame temperature decreases with the increase of dust concentration. The analysis shows that when the oxygen is sufficient in the open space, the dust particle size is the same and the flame propagation speed is similar, the higher the dust concentration is, the more heat is absorbed by the unburned dust particles, which leads to the relatively low flame temperature of the dust cloud with high concentration. Fig. 10 (B) shows the variation of the distance of free flame propagation with time, and the velocity and acceleration curves of flame propagation in open space can be obtained on the basis of this curve. Fig. 10 (C) and Fig. 10 (d) show that in the early stage of dust cloud combustion (0 ~ 20ms), the dust flame propagation speed and acceleration at four concentrations are approximately equal, and in the late stage of dust cloud combustion (20 ~ 40ms),The flame propagation speed and acceleration of high concentration dust are relatively large, because there is sufficient oxygen in the open space, and the high concentration dust has more particles to participate in the combustion in the later stage of flame propagation, and releases more heat, so the flame propagation speed and acceleration of high concentration dust are also increased.
Fig.10 Flame parameters of TiH2 dust with different concentrations varying with time in an open space图10 敞开空间内不同浓度TiH2粉尘云火焰参数随时间变化 |
Full size|PPT slide
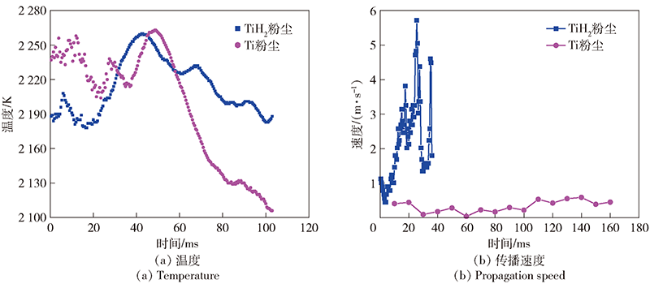
When heated, TiH
2 particles release hydrogen, and the hydrogen inside them changes from combined state to free state
[11]. In order to study the effect of hydrogen in TiH
2 on its flame characteristics, the flame temperature and propagation speed of TiH
2 and Ti dust cloud with concentration of 833g/m
3 were compared. As shown in Fig. 11 (a), the initial temperature of TiH
2 dust cloud is lower than that of Ti dust cloud under the same concentration, which is caused by the endothermic decomposition reaction of TiH
2 particles, and the maximum temperature is slightly lower than that of Ti dust cloud.However, the time for the TiH
2 dust cloud to reach the highest temperature is short due to the disappearance of the interstitial effect of TiH
2 particles by hydrogen and the combustion rate of hydrogen is much higher than that of Ti particles, and the temperature of the TiH
2 dust cloud decreases more slowly than that of Ti dust cloud because the heat released per unit mass of hydrogen is much greater than that of titanium powder
[12]. Fig. 11 (B) shows that the flame propagation speeds of TiH
2 and Ti dust clouds with the same particle size and concentration fluctuate between 1.5 and 5.8 m/s and 0.4 and 0.6 m/s, respectively, and the flame propagation speed of TiH
2 dust cloud is nearly 10 times that of Ti dust cloud, again because hydrogen makes the gap effect of TiH
2 particles disappear and its flame propagation speed is much higher than that of Ti particles, resulting in an increase in the flame propagation speed of the entire TiH
2 dust cloud system.
Fig.11 Comparison of flame parameters of TiH2 dust and Ti dust at 833g/m3 concentration图11 浓度833g/m3的TiH2和Ti粉尘云火焰参数对比 |
Full size|PPT slide
3.2 Flame Characteristics of TiH2 Dust in Duct
The flame characteristics of TiH2 dust cloud in a semi-open Hartmann tube were studied. Fig. 12 is a high-speed camera image of a TiH2 dust cloud flame with a concentration of 896g/m3 propagating in a Hartmann tube, and fig. 13 is a cloud image of the flame temperature dynamic distribution corresponding to one of them. It can be seen from Fig. 12 that the flame propagates spherically in the early stage (0 – 6 ms), and then the flame only propagates upward in the later stage due to the radial constraint of the tube wall. It can be seen from Fig. 13 that the overall temperature in the early stage of flame propagation is about 200 K lower than that in the later stage of stable combustion, because there is a growth acceleration period in flame combustion. In addition, different from the temperature distribution characteristics of the dust flame in the open space, with the upward propagation of the flame, the temperature of the flame front in the tube is lower than the internal temperature, and the temperature increases from top to bottom. This is because before the cardboard on the top of the Hartmann tube is broken, the system is always in a sealed state, the heat generated by combustion and the combustion wave propagate downward, and due to gravity, the dust concentration at the bottom is higher than that at the top, so the more heat generated by combustion, the higher the temperature.
Fig.12 High-speed camera photos of TiH2 dust cloud flame propagated in a tube图12 管道内TiH2粉尘云火焰传播高速摄像 |
Full size|PPT slide
Fig.13 High-speed two-dimensional dynamic temperature distribution maps of TiH2 dust cloud flame propagated in a tube图13 管道内TiH2粉尘云火焰传播高速二维温度动态分布 |
Full size|PPT slide
Fig. 14 shows the flame temperature dynamic distribution nephogram and the time history curves of flame distance, propagation speed and acceleration when the dust cloud concentration of TiH
2 in the duct is 538g/m
3, 712g/m
3, 896g/m
3 and 1076g/m
3, respectively. The mass of TiH
2 powder corresponding to the dust concentrations 538g/m
3, 712g/m
3, 896g/m
3, and 1076g/m
3 in the experiment was 0.6 G, 0.8 G, 1.0 G, and 1.2 G, respectively. Fig. 14 (a) shows that the flame temperature of TiH
2 dust with different concentrations is in the range of 2200 ~ 2500 K, and the temperature after stable combustion is about 2430 K, which indicates that the dust concentration in the pipeline has little effect on the temperature. The analysis shows that before the cardboard on the top of the Hartmann tube is not broken, although the oxygen content in the system is limited, the theoretical calculation results show that the optimal dust concentration is 1489g/m
3, which indicates that the oxygen content in the experiment is sufficient. Therefore, the accumulation of heat in the closed space is the main reason for the same flame temperature in the late stage of dust clouds with different concentrations. Fig. 14 (B) is the curve of the distance of the flame propagating upward in the pipe with time, from which it can be seen that at the beginning of the flame propagation (0 ~ 6 ms), the flame is not yet constrained by the side wall of the pipe.The curves of flame propagation distance with time for different concentrations of dust are almost coincident. At the later stage, due to the constraint of the pipe wall and the influence of dust concentration, the flame propagation distance with different concentrations of dust begins to accelerate and shows different trends. Fig. 14 (C) and Fig. 14 (d) show that in the early stage of dust cloud combustion (0 ~ 6 ms), the flame propagation speed and acceleration of TiH
2 dust at four concentrations are approximately equal, while in the late stage of dust cloud combustion (6 ~ 20 ms), the higher the dust concentration, the earlier the flame propagation speed and acceleration begin to accelerate. The time for the flame of the TiH
2 dust cloud with concentrations of 538g/m
3, 712g/m
3, 896g/m
3 and 1076g/m
3 to break through the top cardboard is 18 ms, 14 ms, 11 ms and 9 ms, respectively, which indicates that the greater the dust concentration, the shorter the time for the flame to propagate to the top in a finite length of pipe. The oxygen content in the closed pipeline is sufficient, and the high concentration of dust can reduce the gap effect between particles, and the heat transfer rate is faster than that of the low concentration of dust, so the flame acceleration will occur earlier
[20].
Fig.14 Flame parameters of TiH2 dust with different concentrations varying with time in a tube图14 管道内不同浓度TiH2粉尘云火焰参数随时间变化 |
Full size|PPT slide
In addition, by comparing the flame parameters of the same mass (concentration) of TiH2 dust in the open space and the duct, it can be seen that the stable flame temperature of TiH2 dust cloud in the duct is 50 ~ 210 K higher than that in the open space.The flame propagation speed is 6 ~ 15 times faster than that in the open space, and the oxygen content in the two devices is sufficient under the given dust concentration of the TiH2 in the experiment. Analysis shows that the main reasons for the above situation are the heat accumulation of the pipe and the restriction effect of the pipe wall during the flame propagation process.
4 Conclusion
In this paper, open and semi-open Hartmann tubes were used to study the flame propagation and temperature dynamic distribution of TiH2 dust under unconfined and confined conditions. The main conclusions are as follows:
1) In the open space, the flame temperature of TiH2 dust cloud is in the range of 2150 ~ 2400 K; Under the same concentration, the temperature of TiH2 dust cloud decreases more slowly than that of Ti dust cloud, and the explosion flame propagation speed of TiH2 dust cloud is nearly 10 times that of Ti dust cloud.
2) In the confined space of the duct, the higher the concentration of TiH2 dust is, the faster the propagation speed of the explosion flame is, but the temperature of the dust cloud with different concentrations after stable combustion is about 2430 K.
3) The colorimetric temperature measurement method based on Hamilton interpolation algorithm can realize the dynamic reconstruction of the transient flame temperature field, and can accurately measure the speed and acceleration of flame propagation through high-speed image binarization processing and contour detection technology.
{{custom_sec.title}}
{{custom_sec.title}}
{{custom_sec.content}}


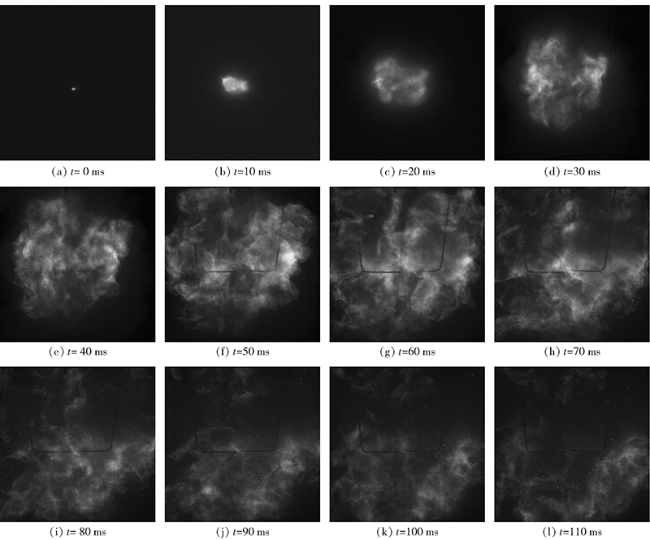
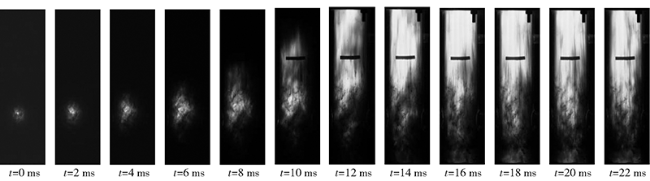
 Fig.1 Particle size distribution and microstructural characteristics


